
Most organizations have no shortage of data.
They have dashboards, reports, data warehouses, data lakes, customer records, operational systems, analytics platforms, and increasingly, AI.
Yet having more data does not necessarily produce better decisions.
The real question is much simpler:
Can you tell me what to do from the data—or better yet, can the system do it for me?
That is the difference between data and actionable intelligence.
Data Is Not the Destination
For years, organizations focused heavily on capturing data.
Collect more customer data.
Store more transactions.
Build larger warehouses.
Create more dashboards.
Track more metrics.
This made sense when data was difficult and expensive to collect.
But technology has changed the economics.
Data collection is becoming increasingly cheap. Sensors generate it. Applications capture it automatically. Customers create it through every interaction. Machines generate streams of operational data. AI systems can process enormous quantities of information.
The bottleneck is no longer:
“How do we get the data?”
It is:
“What are we going to do with it?”
The value of data is therefore not determined primarily by how much you collect.
It is determined by how effectively you use it.
From Descriptive to Prescriptive
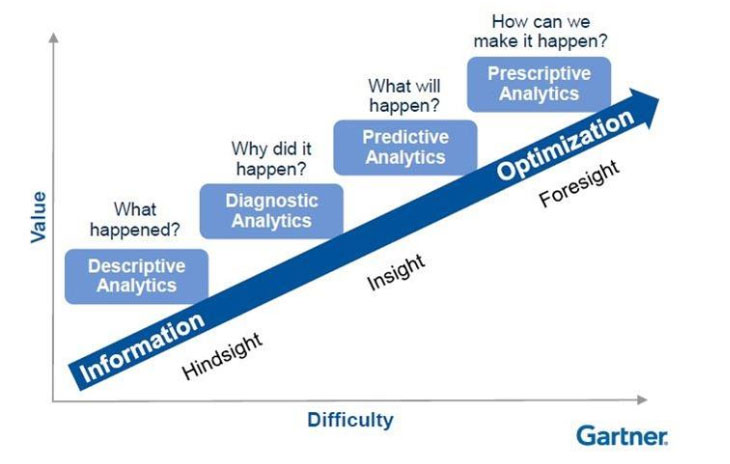
The traditional progression of analytics is often described as:
Descriptive → Diagnostic → Predictive → Prescriptive
Descriptive analytics asks:
What happened?
Diagnostic analytics asks:
Why did it happen?
Predictive analytics asks:
What is likely to happen?
Prescriptive analytics asks:
What should we do about it?
The first three can be useful, but the fourth is where analytics begins to directly influence action.
Imagine a sales dashboard showing that revenue has fallen 12%.
That is descriptive.
An analysis showing that the decline came primarily from a particular customer segment is diagnostic.
A model predicting that the segment will continue declining next quarter is predictive.
But a system that recommends:
“Contact these 47 customers, offer these products, and prioritize these five accounts because they have the highest probability of renewal”
has crossed into actionable intelligence.
The data has become a decision.
The Real Test of a Metric
Organizations love metrics.
Revenue.
Margin.
Customer acquisition cost.
Churn.
Conversion.
Response time.
Customer satisfaction.
Pipeline velocity.
But a metric by itself is not necessarily useful.
A better question is:
What decision does this metric enable?
And an even better question is:
What action should someone take when the metric changes?
Suppose a dashboard shows that customer response time increased from two hours to six hours.
So what?
If nobody knows what to do differently, the organization has successfully measured a problem without solving it.
An actionable metric should create a connection:
Metric → Interpretation → Decision → Action → Outcome
For example:
Customer churn increases → identify at-risk customers → prioritize retention outreach → intervene → measure retained revenue.
Now the metric has a purpose.
The Ultimate Question: “Can You Do It for Me?”
There is an important progression in the maturity of analytics.
Level 1: Tell me what happened.
Reports and dashboards.
Level 2: Tell me why.
Diagnostic analytics.
Level 3: Tell me what will happen.
Predictive analytics.
Level 4: Tell me what I should do.
Prescriptive analytics.
Level 5: Do it for me.
Automation and intelligent systems.
That final transition is particularly important in the age of AI.
Consider fraud detection.
A traditional system might produce a report showing suspicious transactions.
A modern system can identify the transaction, estimate the probability of fraud, determine the appropriate response, and automatically trigger an investigation or additional authentication.
The value isn’t in producing another report.
The value is in changing the outcome.
Application Is More Important Than Capture
One of the most important principles in modern data architecture is:
Data without application is inventory.
Organizations can spend millions building sophisticated data platforms while producing very little business value.
They collect data.
They clean it.
They catalog it.
They govern it.
They visualize it.
But eventually someone has to ask:
What changed because we had this data?
Did we make a better decision?
Did we reduce costs?
Did we increase revenue?
Did we improve the customer experience?
Did we reduce risk?
Did we automate work?
Did we discover a new opportunity?
If the answer is no, the organization may have built an impressive data infrastructure without creating meaningful data value.
This is why modern data teams should think beyond data capture and focus on data application.
Plan Data Is Different
Another powerful use of data is helping organizations move from simply measuring performance to managing toward a desired future state.
Call this plan data.
Most organizations have actual data:
- What we sold
- What customers purchased
- How much inventory we have
- How many employees we have
- How many incidents occurred
But organizations also have goals:
- Sell $10 million
- Reduce churn to 5%
- Deliver within 24 hours
- Reduce operating costs by 10%
- Reach 95% customer satisfaction
The real power comes from connecting the two.
Actual → Plan → Gap → Action → New Actual
For example:
Revenue is $7.5M against a $10M target.
That is not merely a reporting problem.
It creates a management question:
What must change to close the $2.5M gap?
Now analytics can help identify the levers.
Which customers?
Which products?
Which markets?
Which salespeople?
Which opportunities?
Which behaviors?
Which constraints?
The data becomes a navigation system.
Data Should Help You Steer
Think about driving a car.
You don’t need a dashboard that merely tells you where you have been.
You need information that helps you determine:
Where am I?
Where am I going?
Am I on course?
How far off course am I?
What should I change?
Business data should work the same way.
A good data environment connects:
Current State → Desired State → Gap → Recommendation → Action
This is why metrics become much more powerful when connected to goals.
A KPI without a target is merely a number.
A KPI with a target becomes a management instrument.
A KPI with an automated response becomes part of an operating system.
The Data-to-Action Flywheel
The most mature organizations create a continuous loop:
Capture → Analyze → Decide → Act → Measure → Learn → Improve
The action produces a new outcome.
The new outcome becomes new data.
That data improves the next decision.
The organization therefore becomes a learning system.
This is ultimately where AI, real-time analytics, streaming data, and modern data architecture converge.
The objective isn’t simply to make data available.
It is to shorten the distance between something happening and the organization responding intelligently to it.
The New Definition of Data Value
We should therefore rethink how we measure the value of data.
Not by:
- How many terabytes we store
- How many dashboards we have
- How many tables are in the warehouse
- How many users have access
- How sophisticated our technology stack is
But by:
- Better decisions
- Faster decisions
- More accurate predictions
- More effective actions
- More automation
- Better outcomes
The ultimate measure is simple:
What did the data enable us to do that we could not—or would not—have done before?
That is the difference between having data and using data.
And that is the journey from information to intelligence:
Data → Insight → Decision → Action → Outcome
The organizations that win will not necessarily be the ones with the most data.
They will be the ones that can turn data into action faster, more intelligently, and more consistently than everyone else.