For years, data architecture was largely about one question:
How do we get the data into the database?
Modern data architecture asks a very different question:
How do we get the right data into the hands of the right people—or machines—so they can create value from it?
That shift changes almost everything: how we model data, how we build warehouses, how we design pipelines, how we organize data layers, and ultimately how we measure success.
The goal is no longer simply to build a data platform.
The goal is to build a data system that people actually use.
And as usage spreads across an organization, data can shift from an IT capability to a competitive advantage.
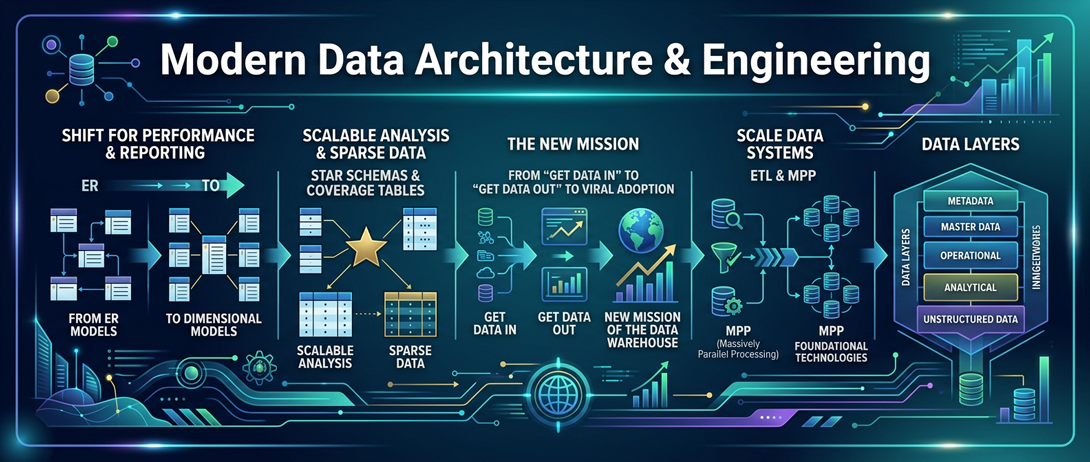
1. From ER Models to Dimensional Models
The Entity-Relationship model is excellent for describing the structure of operational systems.
It answers questions such as:
- What is a customer?
- What is an order?
- What products belong to an order?
- What relationships exist between these entities?
This is exactly what an operational database needs.
But analytical users ask different questions:
- How much did we sell last quarter?
- Which customers are most profitable?
- How does revenue vary by product, geography, and month?
- What changed compared with last year?
Trying to answer these questions directly from a highly normalized transactional model can require complex joins across many tables.
This is where dimensional modeling becomes powerful.
Instead of organizing data primarily around entities and relationships, dimensional modeling organizes it around business processes and analysis.
A typical sales model might contain:
- A Sales Fact table containing measurable events such as quantity and revenue.
- A Customer Dimension describing who purchased.
- A Product Dimension describing what was purchased.
- A Date Dimension describing when it happened.
- A Location Dimension describing where it happened.
The model is designed around the questions people need to ask.
That is an important architectural principle:
The best analytical model is not necessarily the model that most accurately represents the source system. It is the model that makes useful questions easy to answer.
2. Star Schemas and Coverage Tables
Dimensional models naturally lead to the star schema.
At the center is the fact table. Around it are dimensions that provide context.
The result looks deceptively simple. That simplicity is a feature.
A business analyst should not have to understand the physical complexity of an enterprise system to answer a business question.
The star schema creates a semantic structure that is easier for humans, BI tools, and analytical engines to consume.
But what about missing data?
This is where coverage becomes important.
Traditional analysis often focuses on the data that exists. Modern analysis must also ask:
What data should exist but doesn’t?
Suppose a company has 10,000 customers but only 7,500 have complete demographic information.
The absence of those 2,500 records isn’t necessarily noise. It may reveal:
- a broken process,
- a missing integration,
- a customer segment that behaves differently,
- a data quality problem,
- or an opportunity to improve data collection.
Coverage tables can explicitly represent the expected population and whether data exists for that population.
This turns missingness into something measurable.
Instead of saying:
“We don’t have the data.”
You can say:
“We have 75% coverage, and the missing 25% is concentrated in these three customer segments.”
That is a much more actionable statement.
3. From “Get Data In” to “Get Data Out”—and Then to Viral Adoption
For much of the history of data warehousing, success was measured by ingestion.
- How many sources have we connected?
- How many terabytes have we loaded?
- How many tables have we created?
- How quickly can we move data into the warehouse?
Those metrics matter, but they can create a dangerous illusion.
A warehouse full of data that nobody uses is not a successful data platform.
The real measure of value is what happens after the data arrives.
- Can an analyst find it?
- Can they understand it?
- Can they trust it?
- Can they query it?
- Can a product manager use it to make a decision?
- Can an application consume it?
- Can an AI system learn from it?
This represents a progression:
Get Data In → Get Data Out → Get People to Use It → Create Value → Drive Adoption
The final stage is what I would call viral adoption.
A data capability becomes viral when one successful use creates demand for another.
- An analyst discovers an insight.
- That insight improves a business process.
- The business sees the result.
- Another team wants the same capability.
- The data becomes reusable.
- More people discover it.
- More use cases emerge.
- More data is generated.
The feedback loop accelerates.
This is how data becomes more valuable through use.
The data warehouse therefore shouldn’t be thought of as a warehouse in the traditional sense—a place where information is stored.
It should be thought of as a value-generation engine.
The question is not:
“How much data do we have?”
It is:
“How much useful activity does our data enable?”
4. ETL and MPP: The Engineering Foundations
None of this happens without engineering.
Data must be extracted, transformed, transported, stored, indexed, partitioned, compressed, secured, and made available.
That is where **ETL—Extract, Transform, Load—**became foundational.
ETL brought discipline to the movement of data between systems.
But modern cloud architectures have increasingly shifted toward ELT:
Extract → Load → Transform
Instead of doing all transformation before loading the data into the analytical platform, organizations can often load raw data first and use powerful distributed engines to transform it later.
This is possible because of another foundational technology:
MPP—Massively Parallel Processing.
Instead of asking one computer to process an enormous dataset, MPP divides the work across many processing nodes.
A billion-row calculation doesn’t have to be one enormous task.
It can become thousands of smaller tasks operating simultaneously.
This idea extends far beyond traditional data warehouses. Modern distributed systems such as Spark and cloud analytical platforms use parallelism to process enormous datasets efficiently.
But parallel processing introduces its own engineering challenges:
- partitioning,
- data skew,
- shuffling,
- network movement,
- memory management,
- joins,
- serialization,
- and workload optimization.
The modern data engineer therefore needs to understand not just how to write a query, but how the query executes.
5. The Data Layers
Another defining characteristic of modern data architecture is recognizing that not all data serves the same purpose.
A useful architecture separates different layers of information.
Metadata
Metadata tells us what the data means.
It can describe:
- schemas,
- definitions,
- ownership,
- lineage,
- quality,
- security,
- freshness,
- and usage.
Without metadata, an organization may have enormous quantities of data but little understanding of what it represents.
Metadata transforms data from something merely stored into something discoverable and understandable.
Master Data
Master data represents important business concepts:
- Customer
- Product
- Employee
- Supplier
- Location
If different systems have different definitions of “customer,” the organization cannot easily produce a consistent view of the business.
Master data provides a common reference point.
Operational Data
Operational data represents the business as it runs.
Orders are placed.
Payments are processed.
Customers interact with applications.
Inventory changes.
These systems prioritize transactions, availability, consistency, and operational performance.
Analytical Data
Analytical data is shaped for understanding and decision-making.
It may be:
- transformed,
- aggregated,
- dimensional,
- historical,
- enriched,
- or optimized for analytical queries.
This is where the organization turns operational activity into business intelligence.
Unstructured Data
Then there is everything that doesn’t naturally fit into rows and columns:
- documents,
- emails,
- images,
- video,
- audio,
- logs,
- social content,
- and other text.
Historically, much of this information was difficult to incorporate into traditional data architectures.
Modern platforms increasingly allow organizations to combine structured, semi-structured, and unstructured information.
This creates an important architectural opportunity:
The boundaries between “data” and “content” are disappearing.
The Architecture Is Not the Product
There is a final lesson that is easy to miss.
It is tempting to think that modern data architecture is about choosing the right technology:
- Spark or another engine?
- Lake or warehouse?
- SQL or NoSQL?
- Batch or streaming?
- ETL or ELT?
Those decisions matter.
But technology is only the mechanism.
The real architecture is the flow of value.
- Data enters the organization.
- It is given structure and context.
- It is governed and made trustworthy.
- It is transformed into useful analytical forms.
- It is delivered to people, applications, and AI.
- And, most importantly, it produces an outcome.
That suggests a much better definition of modern data engineering:
Modern data engineering is the discipline of designing systems that turn data into repeatable business value.
The ultimate evolution is therefore not:
Data In → Data Stored
or even:
Data In → Data Out
It is:
Data → Context → Insight → Action → Value → Adoption
When that loop becomes faster, easier, and more repeatable, the data platform stops being merely infrastructure.
It becomes part of how the organization thinks, learns, and competes.